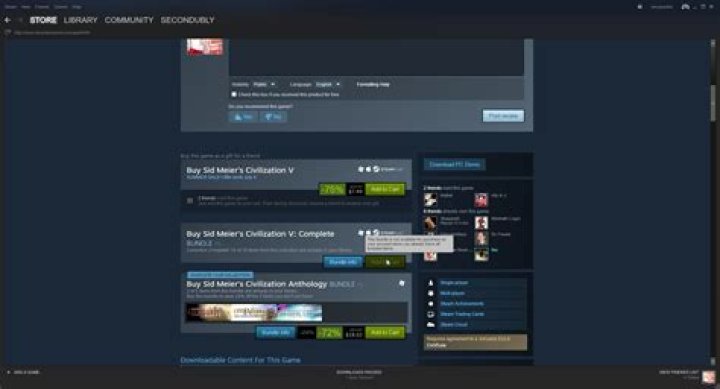
My Chrome do not show the network request list:
you see my snapshot, in the network panel when I refresh the web page, there do not list the request list.
3 Answers
I see your Filter tab is red, so there is no filtered data in it.
you should check if your Filter is selected suitable controls:
check All should be log the HTTP request right.
if you check Doc, Manifest, when you HTTP request, there maybe no logs.
Your preferences have probably become corrupted.
You may reset the preferences by either:
In the Dev Tools Settings, Preferences tab, scroll down and click "Restore defaults and reload"
Run
localStorage.clear()in the Console tab
I know this is from last year, but in case anyone else stumbles on this:
@aircraft was mistaken. The filter is red, which means there is something in the filter search box that doesn't match any of the results, you just can't see the search box. Click the filter to show the search box, delete the contents, all of the network requests will then show up.